How J.P. Morgan Serves Up The ‘Next Best Content’

J.P. Morgan Asset Management has a well deserved reputation for its content prowess, including the Quarterly Guide to the Markets and its many iterations.

Thanks to a vendor-organized Webinar last week, we now have a better idea of the thinking behind the digital experience that the content is used to support.

Below is a screenshot of the 58-minute “Asset Management: The Digital Transformation” presentation featuring idio CEO Ed Barrow and J.P. Morgan’s Global Head of Digital Experience Tom Libretto. It’s not embeddable so you’d have to click on the image or this link to go to the idio page and watch.   

Before you do, I’ll share a few of my notes.

The first 20 or so minutes from Barrow are broad and bounce around a bit. Some of his comments and generalizations throughout may test your patience. (Example: “Clients no longer trust past performance and Morningstar ratings to make investment decisions.”) And, there are more than a few idio product plugs. But hang in there for Libretto’s insights.

Too Much Content?

In the asset management industry overall, Libretto said, “The reality is that we don’t need to produce as much content as we do. We need to understand more and more what types of content, in which formats, wrapped around what type of context, are going to compel a client to engage and take the next step with us.”

Content Planning

At J.P. Morgan, “before there’s heavy investment in content production, we do the due diligence to determine what the objectives of the content need to be or are, and how the content will or won’t be promoted,” he said.

Editorial meetings include regular discussions akin to television programming (e.g., “how many slots do you have to fill?”). That forms the basis for an editorial calendar view of what’s available, identification of formats and syndication opportunities across distribution channels. 

Libretto repeated Barrow’s use of the word “surgical” to characterize how the team determines which formats—including “word counts, font sizes, graphical cues or peeks of content—are capable of driving interest. All of those things are part of the content continuum as we convert from raw material into a digital experience.”

“Emotional conversations” about what content gets produced are avoided by use of a scoring system, according to Libretto. “So,” he said, “when something hits a threshold and we all feel it’s compelling enough to promote, we have the resources to promote that output”—which they do across a multitude of paid and content syndication distribution points.

Data Leads To Content Intelligence

Most fascinating was how J.P. Morgan is merging, cleansing and aggregating its estimated 45 to 50 data sources, as well as buying third-party data, for the purpose of modeling the role that content plays.

In addition to the legacy nature of some systems and system redundancy, the sheer volume of data is a challenge. Libretto’s approach is aimed at determining which types of interactions—face-to-face meeting, Web visit, app open, transaction, etc.—matter and which don’t. Sequence is a focus, too.

To be able to isolate and correlate interactions that are leading indicators to a near-term business transaction provides “a much, much smaller, tighter set of interactions to optimize your strategies around. You can almost discount the others [he estimated that about 90% of the data could be ignored] or use them for other purposes to enhance the client journey,” Libretto said.

The idio solution is one of the tools that J.P. Morgan has begun to use to provide 1)contextual relevance for the content consumer and 2)real-time actionable insight for the firm.

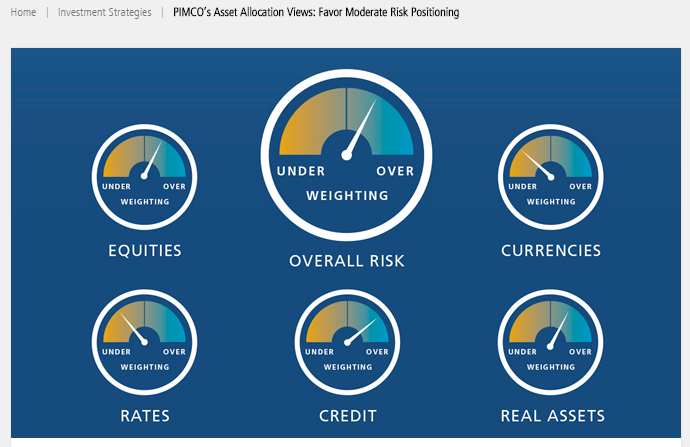
idio’s contribution is on what can be learned from the content being consumed by a visitor to the J.P. Morgan domain. Topic interests are gleaned from the various content pieces accessed, and referred to for the purpose of building a profile that seeks to understand the visitor’s challenges and predict in real-time the next content to offer.

The slide above provides a look at how previous content and conversions drive “next best” content or action recommendations, although few specifics were given. 

idio provides a "data source on which to fire a variety of next step actions, whether it be dynamic content rendering of the next piece of Web content or firing an alert to a salesperson that we have high conviction that somebody who just read something—in combination with other interactions we’ve seen come through over the last n periods—means that a meeting should be queued up sooner or later," Libretto explained.

Measuring Mutual Fund, ETF Content Marketing Effectiveness

I invite you to join me on a tour of two (virtual) rooms. 

The first room we enter is well lit. Lining the walls are neatly stacked, carefully labeled shelves. A handful of focused professionals staff the room and yes, let’s say they’re wearing pressed white lab coats. This is a room where there’s a place for everything and everything is in its place.

Now let’s walk down the hall to a larger room. We could enter the room through any number of doors. People are dashing in and out of all of them, tossing stuff into bins of all sizes scattered here and there. Through a haze, we see a few people who look like they’re in charge. Each has a clipboard; they seem to be sorting and tracking different activity. The overall feeling is one of lots of commotion but not so much order, coordination or meaning.  

These are the scenes I flashed to when I read a Kurtosys survey result that content marketing has surpassed email marketing as the most effective digital marketing practice at asset management firms. (It wouldn’t have made a difference to the top rankings, but I wish display advertising and video channels also would have been included in the survey question.)

On the one hand, this is welcome news! Nothing has consumed the work of mutual fund and exchange-traded fund (ETF) marketers more over the last few years. I’m happy to hear that it’s believed to be working.

At the same time, I couldn’t help but wonder—and forgive me for this—how do you know?

Are You Winging It?

Email marketing has far fewer moving parts and, by now, most firms follow a structured approach to measure its effectiveness. At the most basic level, it’s known whether an email has been opened or clicked through. Firms know which emails have bounced and the number of unsubscribes. Those with marketing automation implementations are associating email interactions with sales-related activity and even revenue.

This work, involving a relatively small crew of specialists, has been mapped out and proven.

We’re trading up from a fairly well understood marketing tactic to a squishy, free-for-all of a content marketing assessment process. Granted, it’s early. But many firms appear to be winging it when it comes to evaluating their content marketing, declaring success by anecdote. 

Survey respondents told Kurtosys that “Client Satisfaction” ranks as the most important metric for measuring digital marketing performance.

About this, Kurtosys ventures, “We’re not sure how they’re measuring client satisfaction, but presumably it’s through proprietary studies and client retention rates.”

Right. If client satisfaction is the most important metric, wouldn’t that mean that mutual fund and exchange-traded fund (ETF) firms have a system in place to link their top tactic to improved satisfaction?

I have my doubts. I don't doubt that financial advisors and shareholders/investors appreciate the industry’s transition from thin, periodic content to a rich stream of content, and I’d believe that a few are expressing their appreciation. But I’m skeptical that a direct line has been drawn from content marketing to client satisfaction. Or between AUM growth and digital and content.

If I hadn’t seen these results, I would have guessed that today’s key metrics have more to do with quantity and quality of “leads” and conversions because that what’s reported and easily counted.

Elsewhere, Kurtosys reports that four in 10 respondents consider “measuring marketing’s return on investment (ROI)” the biggest challenge to digital marketing efforts in the next year, second to compliance and regulatory restrictions. This echoes the cry for help that showed up in Boston Consulting Group’s benchmarking survey of asset management marketers, which I mentioned a few weeks ago.

If you’re committing to content marketing, if it’s your go-to digital strategy, I’d urge you to take a step back and make sure you have clearly articulated objectives and a system to measure the investment you’re making. Borrow from whatever discipline and rigor and control you have over the assessment of your email activity today.

When you’re awash with data (and the average content publisher is swimming in metrics), there’s the temptation to mix and match to tell the best story. Be careful with that. Being accountable while hoping to secure additional funding for continued content work mandates that you keep it both measurable and real, quarter after quarter.

Cookie Cutter Metrics Won't Cut It

I have some confidence in this research. Kurtosys, a specialist in the space (see their 2013 guest post on this blog), says its findings are based on nearly 200 qualified respondents representing a range of fund and wealth management firms of all sizes.

What I’d caution you about are the results of a broader financial services study recently released by the Content Marketing Institute (CMI). The CMI does outstanding work, but I’d argue that this research is of limited usefulness for the asset management marketer. (This isn’t unusual with “financial services marketing” reports.)

According to the SlideShare presenting survey highlights, the survey cast a wide net and collected responses from 5,167 representing a range of industries, functional areas and company sizes. The SlideShare report is based on 117 responses from a mix of B2B and B2C marketers in accounting/banking/financial institutions.  

Note that the order of the organizational goals differs from what Kurtosys found (e.g., social media engagement is dead last in the asset manager marketer survey). But the list itself isn't at odds with what your firm's goals might be. At this point, I suspect brand awareness is a leading focus for content-producing asset managers, as well.

The CMI survey’s “metrics for content marketing success” are the reason I’m calling your attention to this—although only to suggest that you not pay attention.

The #1 financial services content marketing metric is Website traffic. That’s consistent with what typically ranks as the #1 metric for most industries surveyed, according to the CMI.

Website traffic and time spent on sites may be appropriate for retail banks. For asset managers, a campaign-related traffic spike is thrilling, to be sure. And, I’ll confess to an ongoing curiosity about mutual fund and ETF Website traffic levels.

But site traffic cannot be the endgame for a marketer whose products are distributed by intermediaries or other platforms. The effectiveness of what you’re doing with your content is going to be seen elsewhere, including far afield from your own domain.

You deliver your full blog content via RSS feeds, you publish to LinkedIn, Twitter, Facebook and media sites, your videos are viewed on YouTube, your value-added work is distributed at events or on partners’ sites, etcetera.  

The risk of winging it or of defaulting to off-the-shelf financial services industry metrics is that they will unquestionably understate the value of what you and your team have been up to.

I’d like to see you march into that messy content measurement room and throw a lasso around everything you’re producing and delivering, including where, how, for whom, by whom, why and at what cost. Only then will you have a handle on the totality of your effort, and you will be on your way toward strategic thinking about how to measure its reach and impact.

5 For The Campfire: Ebooks A Fund Marketer Could Cozy Up To

Marshmallows? Check. Graham crackers? Check. Hershey bars? Got ‘em. Hey and how about these—if you’re heading out for a well-deserved vacation in the great outdoors, why not grab a few ebooks/whitepapers for your campfire reading pleasure?

Here’s a quick look at five—four of them based on research—I’ve downloaded lately. (This is the second in a series, preceded by last July’s Beach Reading For The Mutual Fund, ETF Marketer.)

Get Your Brag On

If I could make one tweak to the approach of just about every asset manager content team I observe online and offline, it would be to amp up the promotion of the content that’s being produced. Too much light is being hidden under too many bushels.

And marketers in this industry are not alone—failure to promote is an epidemic across brands, according to the Content Promotion Manifesto.

Author Chad Pollitt takes an editorial approach when discussing channels, tactics, tools and budgeting for content promotion, including citing the work of other content marketing leaders. Of course, he invokes the famous line “Content is King, but Distribution is Queen and She Wears the Pants” by BuzzFeed’s Jonathan Perelman.

It’s an entertaining 85 pages (!) with a dead-serious message.

Social Selling Crushes Quotas

More than halfway into the year, I’m calling it—2015 was the year mutual fund and ETF sales teams “got” social media. Others were earlier (see post). And, the training on the basics, the coaching on participating and yes, the coaxing of those who hang back will continue well beyond 2015.

But Sales leadership and teams at firms large and small are paying attention this year, and they want in.  

By and large, the interest is in what can happen on LinkedIn (seerelated post). This make sense. Wholesalers want to go where the most financial advisors are, and that’s LinkedIn. Interestingly, The Ultimate Sales Guide to Crushing Your Quota: The Impact of Social Media Usage on Sales Performance and Corporate Revenue reports on a survey of social media-savvy sales professionals who rank the value of Twitter a tad higher. Even survey authors KiteDesk and A Sales Guy Consulting admit to being surprised.

“I like to describe Twitter as the bar after work—where you keep your tie on but loosen it a bit, and LinkedIn is the conference room in the corporate office. Due to the fast and collaborative nature of Twitter, a salesperson can effectively share an idea or engage with a prospective client through a pithy missive. When the exchange goes well, it can then be moved to LinkedIn—which represents a much larger personal commitment,” one social selling influencer explains.

But that’s just one insight in the 28-page report. I recommend this to you for its perspective (survey data and quotes) on B2B sales pros who have a jump on your teams in understanding how to use social media to close deals and meet goals.

Let’s Start With The Right Questions

I could cut right to the chase and tell you that the average respondent to this State of Marketing Automation Maturity survey answered 56% of the questions “correctly” and scored a grade of C. But there’s more to benchmarking marketing automation maturity than that, as the Spear Marketing Group expounds in 14 pages.

You’ll read the survey results on 33 best practices in several categories including analytics and reporting, lead scoring and data hygiene. I wonder whether the questions themselves may be of even greater use to you, especially if you’re early in your adoption of marketing automation.

Expectations Of The Connected

Let’s see, we’ve surveyed the salespeople and the marketers. Who’s left? The investors!

The 2015 Wealth Management for Connected Investors from Salesforce Research is based on responses from than 1,000 participants—millennials, Gen X and baby boomers. The 13 pages include a lot on investors' relationships and communications with financial advisors, which is helpful.

See page 8 for a question I don’t remember others asking previously—“How do you currently keep track of your financial record(s)?” Millennials (36%) show more comfort with electronic methods like cloud storage, as Salesforce mentions three times on the page. That emphasis itself I found intriguing.    

Where To Draw The Line

The shortest document (9 pages) in this collection may be the most difficult for you. Just as the technology exists to enable marketers to start doing some really interesting, targeted communicating, privacy concerns threaten to kill the buzz. On top of that, consumers expect more of financial services firms.

What is Privacy Worth to Your Customers?  is based on a Communispace survey of 3,000 consumers, building on work done in 2014. The focus of this report is on consumers’ willingness to provide personal financial data online in order to use a tool or create a profile—and their expectations of what the Website providers will do with that data. 

This research is broader than just investment companies but don’t miss the first bar on the graph on page 7—one-third of consumers are not OK when an investment company Website tailors content based on the visitor’s age.

You and your firm are likely having internal discussions on privacy, this research will help frame the data-for-value exchange. Not touched on by this work but worth thinking about, too: your financial advisor clients also have a privacy line to keep in mind with your digital outreach, as well.

Enjoy—and watch those pesky mosquitoes!

If Being Visual Isn’t In Your DNA, Change Your DNA

“Being visual just isn’t in our DNA,” one workshop participant pushed back by piping up. “We can do words—lots of words—but we don't do pictures,” she said as her colleagues nodded in solidarity.

OK, that’s a belief that has been too prevalent and if it’s afflicting your organization, you need to stomp it out. DNA can be changed (see this New York Times report, for example) and so can the way every mutual fund and exchange-traded fund (ETF) firm communicates. "To be visual" simply requires conviction and resources that include bigger fonts and brighter colors. You can do this.

This post revisits a favorite topic (see the July 12, 2012, “Asset Managers Start To Say It In Pictures”) but with added urgency. The most dramatic recent change to content posted to asset manager Websites—and especially to blogs, those insatiable beasts—has been in the visual appeal of the content.

To be sure, many firms are still extracting those sad scans of grayscale charts used in previously created (!) documents and passing them off as visual relief on all-gray Web pages.

But, more and more marketers are reading the memo—visuals help the brain process information, essentially facilitating communication.

source: optimaltargeting.com

source: optimaltargeting.com

The image above is an excerpt from a larger Optimal Targeting infographic called "The Future of Marketing." Yes, that's how important images are to marketing. Others’ visual communications competency is evolving and yours must too if you expect your customers and prospects to pay attention to what your firm has to say in 2015.

For one window into the very best graphics being published by asset managers, check out the social media accounts of your competitors or firms you have a particular interest in.

You’ll get an idea of both the content the firm is publishing and what’s getting shared. You may be surprised. If your content isn’t visual and inviting, it’s getting much, much less social support. The screenshot below shows the Photos & videos tab on the @JPMorganFunds Twitter account, as an example.

Here’s a quick review of some of what I’ve been noticing, in my visits to Websites and following social updates.

Keeping It Simple…

Simplicity is the key to this Nationwide Funds small caps vs. large caps graph shared on Twitter. There’s no proprietary data here, any fund manager could create this chart and many do. But the team behind this graph made a smart decision to downplay or even eliminate all but the necessary data points. 

This stripped down version makes it possible for followers to get the main point from the visual as they encounter it in their tweet stream. The underlying Website contains all required information.

This Prudential Investments chart is another example of, when possible, less is more.

…And Quick

In fact, visuals don’t necessarily have to be made in-house. When time is of the essence, AdvisorShares (and other firms) regularly relies on screenshots of trading screens to make a point.

Dense With Data

Then again, some firms are taking the time to produce data-based interactives for their sites.

For example, here’s Putnam’s chart on the U.S. labor market recovery. Nothing about these—not the creation and maintenance of the graphic or the user’s consumption of it—is simple and quick.

Assuming your visual expounds on something of ongoing interest, a data-dense chart could be a consistent contributor for you. It could draw attention to your site and foster engagement.

And, given that the year is 2015, whatever you do has to look good on a smartphone, too. See how well the Putnam graphic works when shrunk to fit a phone in portrait mode.

Spare The Word, Save The Reader

If there ever was a firm with visual DNA, it would have to be Russell Investments, whose Economic Indicators Dashboard has been a thing of beauty for years. Note how few words are used in Russell’s newer Market Expectations graphic.

Spare The Word, Save The Reader, Part 2

But even PIMCO, home of the long form narratives, is going visual. Having first appeared in a PDF at the beginning of the year, this updated Asset Allocation Views graphic now appears on the PIMCO blog.

As if inspired by Cliff's Notes, this Fidelity graphic provides five takeaways of a wordy business cycle update. The image appears on the update page on Fidelity's site and was used in a tweet. What about this couldn't you do?

Show A Little Love To Product

Finally, these charts from OppenheimerFunds offering “good reasons to avoid timing the senior loan market” serve as a reminder to extend your visual capability to product communications, too.

In this case, when the visual on the Website itself needs to be enlarged in order to be appreciated, it obviously won’t work as a social-worthy graphic. That’s when you need to create a separate image, probably a subset of the larger image, to share. It's an extra step that will be worth your time.

Just 5 Sites Command Almost Half Of All Finance Keyword Search Rankings

May I just say how much I love a free online tool?

The latest object of my affections is Ayima Pulse, which is a visualization of Google search rankings on more than 50,000 non-branded keywords. It offers “share of voice” leaderboards on the top Websites in 10 verticals, including Finance. (Insurance gets its own leaderboard, which is a refreshing departure from tools that track finance and insurance under one big ole financial services bucket.)

You’ll want to go and check it out yourself, but here’s what I’ve gleaned after spending some time on the site.

Search Ranking Volatility

Ayima provides a look at daily ranking changes over the last 30 days. According to the latest data, Finance search rankings are not volatile.

This has particular relevance now. We are just past the April 21 start of the rollout of "mobilegeddon," when Google said it would change its search algorithms to remove non-mobile-friendly sites from searches conducted on mobile devices. The expectation was that rankings would be significantly re-sorted as some sites would drop, the result of a Google penalty.

However, the Ayima data suggests that it was a non-event for Finance search leaders, judging both from the flatness of the volatility graphs and from a comparison of the leaders on desktop and mobile search. This looks to be the case, incidentally, for all the verticals except Gambling.

Finance Search Ranking Volatility.png

Search Leaders

What Ayima calls "Visibility (share of voice)" is calculated from the search volume, ranking and estimated clickthrough rate (CTR) of all sector keywords, converted into an overall percentage. Arrows indicate site movement within the leaderboard from the previous day.

Finance Search Ranking Leaders.png

To the right are the top 10 Websites ranking for Finance keywords. I've been watching this daily updated ranking for several days, by the way, and CNN and Yahoo frequently trade places between #1 and #2.

No investment product providers have broken into the top 10. Just two investment company brands—Fidelity at #34 and Schwab at #61—are on the larger list of 100 sites that Ayima makes available. Each site has less than 1% of share of voice. Related: Morningstar.com ranks #31.

Below is a look at how Fidelity and Schwab search visibility on mobile devices has fluctuated over the last 30 days. Fidelity has been more up and down, but both are labeled as mobile-friendly by Google and neither appears to have suffered from the algorithm change.

Schwab Fidelity Search Rankings.png

Search Concentration

The top five Finance Websites command 48%, or almost half, of the top finance keyword search rankings. That leaves every other finance site to slug it out for the other top keywords.

This is second only to the Jobs vertical—the top five Jobs sites snag 64% of their keyword rankings. There’s the least concentration in Education, where the top five leaders in that vertical attract have just 19% of all organic search rankings.  

Finance Desktop Search Ranking Concentration.png
Finance Mobile Search Ranking Concentration.png

Fear Of Missing Out?

So, what's to be made of the fact that mutual fund and exchange-traded fund (ETF) firms are nowhere to be found on the list of the top 100?

Buck up there, SEO-aware and socially-savvy asset management marketer, it's not a certainty that your sites are missing out. This is not necessarily a reflection of investment companies’ search performance because there are at least two pieces of information we don’t have:

  • We don’t know what the top 50,000+ Finance keywords are (an email I sent to Ayima has yet to be answered). In its April 20 introduction to Pulse, Ayima explained that “at midnight each day, we take Google’s top 100 organic search results for the most popular non-branded keywords relevant to our top 10 industries and add them to our database.” For a general idea of the top 1,000-ish Finance keywords, of course, you can always consult the Google AdWords Keyword Planner.
  • We don’t know what individual firms are seeking to rank for. Your keywords are probably long-tail. But...in an array of 50,000 keywords, there are likely to be words you want.

If you’re feeling competitive, I wouldn’t look at the top of the list where it can be no surprise that the media sites dominate. I’d look toward the bottom of the list. What do Visa’s PracticalMoneySkills.com (#94) and the American Finance Association Journal of Finance site (#62) do that you don’t? Should OurFreakingBudget.com (#83) outrank your site? Hmm, who knew that Pinterest.com (#27) was ranking for finance keywords?

On the topic of being anti-competitive, let’s take a moment to consider Google.com’s #3 ranking. Finance keyword searchers use Google, only to be taken by Google search engine rankings to a Google property (Google Finance or even just an inline result—see this post) almost 10% of the time? Interesting. 

If you spend your days thinking about how to effectively use Search to draw people to your business online, the visibility and volatility data provided by Ayima is all pretty interesting. It's another valuable tool to add to the digital marketing toolbox.