Measuring Mutual Fund, ETF Content Marketing Effectiveness

I invite you to join me on a tour of two (virtual) rooms. 

The first room we enter is well lit. Lining the walls are neatly stacked, carefully labeled shelves. A handful of focused professionals staff the room and yes, let’s say they’re wearing pressed white lab coats. This is a room where there’s a place for everything and everything is in its place.

Now let’s walk down the hall to a larger room. We could enter the room through any number of doors. People are dashing in and out of all of them, tossing stuff into bins of all sizes scattered here and there. Through a haze, we see a few people who look like they’re in charge. Each has a clipboard; they seem to be sorting and tracking different activity. The overall feeling is one of lots of commotion but not so much order, coordination or meaning.  

These are the scenes I flashed to when I read a Kurtosys survey result that content marketing has surpassed email marketing as the most effective digital marketing practice at asset management firms. (It wouldn’t have made a difference to the top rankings, but I wish display advertising and video channels also would have been included in the survey question.)

On the one hand, this is welcome news! Nothing has consumed the work of mutual fund and exchange-traded fund (ETF) marketers more over the last few years. I’m happy to hear that it’s believed to be working.

At the same time, I couldn’t help but wonder—and forgive me for this—how do you know?

Are You Winging It?

Email marketing has far fewer moving parts and, by now, most firms follow a structured approach to measure its effectiveness. At the most basic level, it’s known whether an email has been opened or clicked through. Firms know which emails have bounced and the number of unsubscribes. Those with marketing automation implementations are associating email interactions with sales-related activity and even revenue.

This work, involving a relatively small crew of specialists, has been mapped out and proven.

We’re trading up from a fairly well understood marketing tactic to a squishy, free-for-all of a content marketing assessment process. Granted, it’s early. But many firms appear to be winging it when it comes to evaluating their content marketing, declaring success by anecdote. 

Survey respondents told Kurtosys that “Client Satisfaction” ranks as the most important metric for measuring digital marketing performance.

About this, Kurtosys ventures, “We’re not sure how they’re measuring client satisfaction, but presumably it’s through proprietary studies and client retention rates.”

Right. If client satisfaction is the most important metric, wouldn’t that mean that mutual fund and exchange-traded fund (ETF) firms have a system in place to link their top tactic to improved satisfaction?

I have my doubts. I don't doubt that financial advisors and shareholders/investors appreciate the industry’s transition from thin, periodic content to a rich stream of content, and I’d believe that a few are expressing their appreciation. But I’m skeptical that a direct line has been drawn from content marketing to client satisfaction. Or between AUM growth and digital and content.

If I hadn’t seen these results, I would have guessed that today’s key metrics have more to do with quantity and quality of “leads” and conversions because that what’s reported and easily counted.

Elsewhere, Kurtosys reports that four in 10 respondents consider “measuring marketing’s return on investment (ROI)” the biggest challenge to digital marketing efforts in the next year, second to compliance and regulatory restrictions. This echoes the cry for help that showed up in Boston Consulting Group’s benchmarking survey of asset management marketers, which I mentioned a few weeks ago.

If you’re committing to content marketing, if it’s your go-to digital strategy, I’d urge you to take a step back and make sure you have clearly articulated objectives and a system to measure the investment you’re making. Borrow from whatever discipline and rigor and control you have over the assessment of your email activity today.

When you’re awash with data (and the average content publisher is swimming in metrics), there’s the temptation to mix and match to tell the best story. Be careful with that. Being accountable while hoping to secure additional funding for continued content work mandates that you keep it both measurable and real, quarter after quarter.

Cookie Cutter Metrics Won't Cut It

I have some confidence in this research. Kurtosys, a specialist in the space (see their 2013 guest post on this blog), says its findings are based on nearly 200 qualified respondents representing a range of fund and wealth management firms of all sizes.

What I’d caution you about are the results of a broader financial services study recently released by the Content Marketing Institute (CMI). The CMI does outstanding work, but I’d argue that this research is of limited usefulness for the asset management marketer. (This isn’t unusual with “financial services marketing” reports.)

According to the SlideShare presenting survey highlights, the survey cast a wide net and collected responses from 5,167 representing a range of industries, functional areas and company sizes. The SlideShare report is based on 117 responses from a mix of B2B and B2C marketers in accounting/banking/financial institutions.  

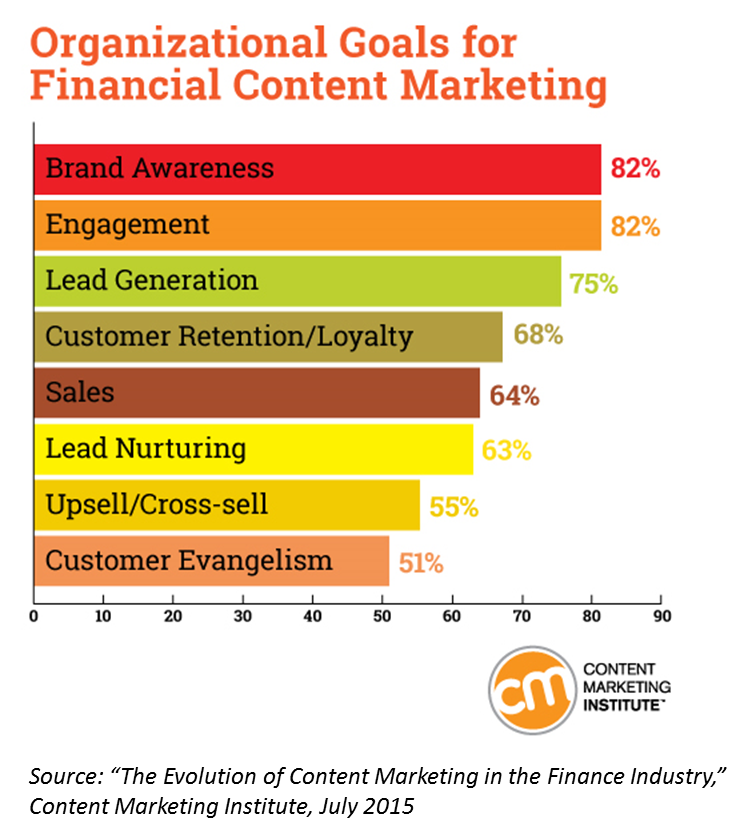
Note that the order of the organizational goals differs from what Kurtosys found (e.g., social media engagement is dead last in the asset manager marketer survey). But the list itself isn't at odds with what your firm's goals might be. At this point, I suspect brand awareness is a leading focus for content-producing asset managers, as well.

The CMI survey’s “metrics for content marketing success” are the reason I’m calling your attention to this—although only to suggest that you not pay attention.

The #1 financial services content marketing metric is Website traffic. That’s consistent with what typically ranks as the #1 metric for most industries surveyed, according to the CMI.

Website traffic and time spent on sites may be appropriate for retail banks. For asset managers, a campaign-related traffic spike is thrilling, to be sure. And, I’ll confess to an ongoing curiosity about mutual fund and ETF Website traffic levels.

But site traffic cannot be the endgame for a marketer whose products are distributed by intermediaries or other platforms. The effectiveness of what you’re doing with your content is going to be seen elsewhere, including far afield from your own domain.

You deliver your full blog content via RSS feeds, you publish to LinkedIn, Twitter, Facebook and media sites, your videos are viewed on YouTube, your value-added work is distributed at events or on partners’ sites, etcetera.  

The risk of winging it or of defaulting to off-the-shelf financial services industry metrics is that they will unquestionably understate the value of what you and your team have been up to.

I’d like to see you march into that messy content measurement room and throw a lasso around everything you’re producing and delivering, including where, how, for whom, by whom, why and at what cost. Only then will you have a handle on the totality of your effort, and you will be on your way toward strategic thinking about how to measure its reach and impact.

Yes! LinkedIn Releases Its Social Selling Index Benchmarking To The Masses

There seems to be no end to the fascination the financial services industry—and mutual fund and exchange-traded fund (ETF) firms in particular—have for the potential of LinkedIn to help drive sales and revenue.

Content-wise, the Economy and Finance & Banking are among the most popularly followed LinkedIn channels, and this certainly warms the hearts of content marketers. But personal brand-building and relationship data tracked by LinkedIn suggests that there are miles to go before LinkedIn-connecting will contribute, at least at a meaningful level, to business results.

LinkedIn today announced a step that should help those of you hard at work training and empowering your sales forces on LinkedIn. This post updates a topic I commented on in June.

If you’re in a hurry, here’s the short version of what follows: Log in to LinkedIn and click on https://www.linkedin.com/sales/ssi to see your own Social Selling Index (SSI) as of today. At the same time, you’ll see measures of how you rank in your industry and your network. Each one of your wholesalers, national accounts, institutional and inside salespeople should be able to see the same when logged in to their accounts. This is a benchmark off which all efforts can start to be measured.

Because we’re all friends here, I’ll share my SSI to give you an idea of where I need to improve to be a better social seller. Seventy on a scale of 100 is not a score I’d ever be happy with—the fact that a 70 ranks in the top 1% of the financial services industry points to the industry’s room for improvement. As social media coaches do their magic across the asset management industry, I will expect—even root for—this ranking to sink.

Some Background

For your background, LinkedIn’s Social Selling Index is a metric developed to help sales professionals benchmark their performance across the four pillars of social selling:

  • The creating of a personal brand
  • Finding the right people
  • Engaging with insights
  • Building strong relationships

Each of these is measured on a 1-25 point scale for a possible high score of 100. The higher the SSI, the better a professional is positioned to connect with leads, and ultimately close more sales, according to LinkedIn. 

Average SSIs of financial services and insurance sales professionals are low across the board—22.1 on a 100-point scale as of August 2014 data. Professionals in just the investment management industry scored a tad better—22.8 as of November 2014 data. See my June 2015 post for more data and detail.

The post I’d written two months ago expressed begrudging admiration for the SSI.

Why the admiration (I actually called it “genius”)? By creating a benchmarking approach and assigning scores, LinkedIn found a way to drive adoption of a performance measure on which tracking improvement is possible only by heightened use of their Sales Navigator platform.

Why begrudging? After sitting in on multiple Webinars and other discussions, I felt that LinkedIn was teasing us in an unhelpful way. Everyone who has a LinkedIn profile has an SSI computed by LinkedIn but to find out what yours was, you needed to talk to a sales rep. Also, the still active (as of this morning) LinkedIn page where you can submit a request to get your SSI has an asterisked note that the SSI is for companies with over 100 employees and 10 sales reps.

This command and control approach made me crazy—a user’s participation on the LinkedIn platform revealed something to LinkedIn that they didn’t in turn share with the user? They could help all, but chose to help just the paying customers? From a new media platform that was old school.

But this change makes it right. According to an email I received from LinkedIn this morning, the index is available to all 380 million users. Obviously, not all are going to care about their social selling competency but many will. Sales managers and trainers will still need to access the LinkedIn product to see multiple SSIs, I’m assuming.

Onward and upward.

6 Odd Examples Of Your Mutual Fund/ETF Dollars At Work

I once worked for a good guy who needed to grow into his ability to hold staff meetings.

In the early days, it was rough going—a dozen people jammed into a small conference room as we listened to Horace (not his real name) review the contents of his (paper) InBox piece by piece as a means of updating us. His interpretation of company memos, his analysis of competitors' work, his far-reaching commentary…until the hour struck and the meeting was over, bringing sweet relief for all.

Today’s post is not that, I hope. Maybe you’ll find something worthwhile in this random walk-through of what I’ve been clipping lately for my mutual fund/exchange-traded fund (ETF) marketing scrapbook.

Not In My House You Don’t

I have mixed feelings about tweets like this brief video of a BlackRock office (in the UK?) before a meeting was about to start. The behind-the-scenes look of it is what gives it appeal—I agree and I get it. But my stronger reaction is horror.

I’m making an assumption here, it’s possible that this was a completely sanctioned video. Allowing for that to be the case, let’s use it just as a jumping off point to something more general: If there’s one consistent message I have for every firm I work with, it’s that they lock down/rule out/expressly forbid views like this created and shared by outsiders.

Social updates showing the inside of an asset manager office or meeting (including presentation slides!) almost always serve to aggrandize the outsider (typically a vendor) only. They do nothing for your business and can cause trouble. I don’t like showing people in unguarded moments in general, my loved ones excluded. But you can imagineand your Legal and Compliance colleagues can fill in any gapsthe risks of others sharing in real-time what’s happening under your roof.

Just say no, in your meeting invitation, at the start of your meeting and at the conclusion of your meeting.

Wholesaler As LinkedIn Publisher

Wholesalers using LinkedIn to amplify their firms’ content and otherwise interact is old news (see this 2013 post). But this self-promotional LinkedIn publisher post by a new Virtus wholesaler was a new one on me when I spotted it a few months ago. 

LinkedIn didn’t cross its 1 million publishers and 1 million posts milestones this year solely on the backs of 5,000 words on climate change insights or what’s in a CEO’s purse. Why not this, I guess.

Can You Say Takeover?

Franklin Templeton Sponsored Content

Fund companies are taking part in an advertising trend that’s prevalent across most industries: sponsored content. The purpose of online sponsored content is to give an advertiser editorial placement similar to magazine advertorials in print.

I “wowed” out loud when I landed on this Think Advisor page, which leaves no doubt who’s sponsoring both the editorial and advertising on the page. Franklin Templeton “owns” the page with seven placements. I spotted this in April and then again earlier this week but your results may vary.

It’s Not You, It’s Them

On the very day in May when David Letterman retired, Fidelity was ready with a Letterman-esque Top 10 countdown to retirement.

@Fidelity is one of the largest Twitter accounts (translation: plenty of potential follower support) and easily the most interactive (replies 64% of the time versus 0% for most asset manager accounts). This should have been a can’t miss/slam dunk.

And yet there were just seven retweets. The graphic did better (76 likes and 21 shares) on Facebook although still less than I would have guessed.

Huh. This was a brilliant idea. Why didn’t it catch on?! Maybe the update copy didn't (or couldn't) go far enough to snag attention?

Don’t ever let anyone tell you that a chimp can do social media.   

In A Keyword League Of Its Own

There are all kinds of ways people can use to find their way to your site, but organic search continues to top the list.

Guess what dominant mutual fund and ETF firm is also crazy dominant in the number of organic search keywords driving traffic to its site? According to SpyFu data, Vanguard has twice as many keywords as T. Rowe Price (the next closest competitor although BlackRock is gaining), and look at the progress made in just the last three years.

I’d show the graph for Vanguard versus just ETF firms, too, but it isn’t pretty. 

ROI Challenged?

This upsetting graph is from a Boston Consulting Group benchmarking survey of asset management marketers. Every data point in this self-assessment of go-to-market capabilities is fascinating.

But the low, low regard that marketers themselves have for their “marketing spending-productivity tracking” is no less than a cry for help. Tragic and unnecessary. Let me know what I can do to help.

A Closer Look At LinkedIn's Bid To Help Your Sales Pros With Social Selling

Over the last few years, social network participation has yielded all kinds of data that’s been used for predicting and measuring effectiveness—and that includes on-the-job effectiveness.

Early on, we saw job postings requiring candidates to have a minimum number of Twitter followers. Some employers advertised for people with a minimum Klout score. Those requirements, meant to serve as a proxy for a job applicant’s social stature, have largely gone by the wayside. The measures themselves were proven to have little bearing on an employee’s capability, and some question the science behind influence scores. 

I bring this up now as LinkedIn stages a full-court press with its Social Selling Index (SSI) and Sales Navigator product that promises to improve sales professionals’ effectiveness. If you’re a mutual fund or exchange-traded fund (ETF) company, it’s likely someone has reached out to your Sales management. Advisory firms, even more so, are being courted.

My sense is that there’s an enthusiasm about the SSI, in conjunction with asset managers’ keen interest in building out their overall presence on LinkedIn. After seven years of thinking about social for this business, I hesitate to say anything that could conceivably take away from the benefits that accrue from a systematic embrace of social interactions. I'm all for the listening, learning and connecting that LinkedIn enables, and provides extensive educational support for.

That doesn't mean that I don't have a few questions.

LinkedIn’s approach is different from basing hiring decisions on Twitter followers or Klout scores; its tool is designed to change behavior. But it’s similar in that it makes a correlation (LinkedIn activity drives sales effectiveness) that requires a leap, particularly when it comes to wholesalers calling on financial advisors.  

A New Sales Performance Measure

LinkedIn describes SSI as “a first-of-its kind measure of your company’s adoption of social selling practices on LinkedIn.” The SSI formula was computed based on survey research conducted a few years ago and on behavioral analytics. The screenshot below from a 2014 presentation elaborates on how the formula was developed.

Social Selling Index Formula

According to LinkedIn, adoption of social selling practices has four dimensions: the creating of a personal brand, finding the right people, engaging with insights, and building strong relationships. Each of these can be measured on a 1-25 point scale for a possible high score of 100.

I should say that each can be measured by LinkedIn based on social selling activity that takes place on LinkedIn.

You and I and everyone who has a LinkedIn profile has an SSI computed by LinkedIn, according to our performance on the dimensions, also known as the four pillars of social selling. I heard this at a Webinar I sat in on this week.

However, it’s not so easy to learn what your SSI is. Evidently, attendees to the Sales Connect conference last year were delighted to be welcomed with posters showing their scores, and I’ve seen a few LinkedIn Webinars that reported the SSI distribution of the Webinar attendees.

Otherwise, I think you need to talk to a sales rep. Also, the LinkedIn page where you can submit a request to get your SSI has an asterisked note that the SSI is for companies with over 100 employees and 10 sales reps, which should not be a hurdle for most of you.

This 2:30 video is a succinct explanation of SSI, starting with some data that shares what LinkedIn has learned from tracking its SSI over the last few years. Those with a high SSI score were promoted 17 months faster. SSI leaders have more opportunities per quarter and are more likely than SSI laggards to hit quotas.

It's Genius!

From April 2012 to July 2014, according to LinkedIn, the average SSI performance increased 87%—which LinkedIn attributes to increased participation in its four pillars. There was an average 26% increase in SSI by Sales Navigator customers within three months of their activation, according to the 2014 presentation.

But as you can see from the all-industry and financial services charts below, SSIs today are quite low. Investment management sales professionals, even while near the top of the list, score 22.8 on a 100-point scale.

Industry SSIs
Financial Services SSIs

Marketers, before we go any further, let’s give it up for LinkedIn.

By developing the SSI benchmarking program, LinkedIn has documented a need that its Sales Navigator product can satisfy. They have found a way to drive adoption of a performance measure on which improvement is possible only by heightened use of their platform and their measurement tool.

Calling attention to these low scores suggests the opportunity ahead for those who commit to social selling (activities) and for LinkedIn, too. It's genius!

Success Stories

Just about a year in, there are some Sales Navigator success stories already being told.

The story most related to this business on LinkedIn’s case study page is about Guardian Life Insurance Company of America. A total of 250 agents took part in a pilot, growing their connections by 56%, performing 89,000 LinkedIn profile searches and selling insurance with a face value of $21 million. The PDF doesn’t comment on the agents’ SSIs and any movement there. Other firms including Bain, General Electric and PayPal also report success.

This is new and there are lots of questions not just about outcomes but implementation, which itself can be time-consuming and expensive for regulated investment firms. The Webinar I attended this week was co-hosted by Socialware and LinkedIn Sales Solutions, walking through some of the concerns (and available solutions). Here's the link to the replay, which I recommend you watch.

My great fascination with this program centers on the following:

  • Better rev up the engine. A heightened focus on sharing insights and building relationships within LinkedIn is going to mean much more activity aimed at the finite group of advisors, consultants and others who play a role in choosing and using investment products. 

Activity does not always translate to relevance, let alone effectiveness. Expect added pressure from your Sales partners to produce content and messaging that will help them achieve a healthy SSI.

  • A LinkedIn skew. As I understand it, the value of Sales Navigator is not just in the prospecting support, it’s in the management dashboard that enables trend analysis and coaching for social selling behaviors. Does this mark the beginning of a blend of in-house and outsourced sales performance evaluation?

It will be interesting to see how firms factor in the SSI with other performance measures as tracked by their CRMs. Will the availability of such a measure from LinkedIn and not from Twitter or Facebook (for advisory firms) result in a LinkedIn overweighting?

That would be a shame in my opinion. Twitter offers ample opportunity for friction-free interaction with advisors that could lead to off-line follow-up. I'd hate to see Twitter overlooked as wholesalers are increasingly empowered to establish their own social presence.   

  • Company-level data. LinkedIn is the financial advisors’ preferred network for the connections they can make, and asset managers gravitate to it for the visibility in front of both advisors and business professionals.

Enhancements made over the last few years by LinkedIn have supported opportunities to raise individual and brand awareness. Finding and connecting with individuals happens via powerful search filters that take advantage of how the collected data is architected.

What we don’t hear about anymore is the data that LinkedIn is collecting on companies. Do you recall the company profiles that were once published as a roll-up of all the individual profile activity? Below is a screenshot of the detail of a Google profile from the March 20, 2008, post introducing it. Promotions and changes, most popular employees, career paths, median age, median tenure—it was all there and it was awesome.

I remember once talking to a client tasked with keeping track of the number of CFAs on her firm's investment teams. “Ask LinkedIn, they keep better records on your employees than you do,” I joked. That's still true, more so, but they've stopped publishing it.

Today LinkedIn knows the SSIs of every wholesaler who has a profile on LinkedIn, as low as they might be.

It’s inevitable (and a welcome evolution, I agree) that social selling will become emphasized at investment firms. Firms’ use of Sales Navigator, theoretically driving up SSIs, will assure that LinkedIn will have a reliable map of who the best social sellers/LinkedIn power users are.

Now that's business intelligence, the result of imposing a standard performance measure. I wonder how businesses will get at it.

  • Publish the scores, LinkedIn! LinkedIn knows our social selling proficiency because it practices what it preaches—it pays attention to what members do on its platform. Given that our own account activity is the basis for the score, I wish LinkedIn would abandon its command and control approach to the data. There shouldn’t be any hoops for an individual member to have to jump through to see his or her score. 

I stand on principle on this, by the way. I harbor no illusions about my own no doubt anemic social selling score. But if LinkedIn were ranking asset management marketing consultants (and maybe they are), I'd be that much more worked up about this.

By now, companies making money on user-submitted data is common practice. Google Analytics (although free to most) set a precedent for entrusting your business’ Website data to a third party in exchange for the utility of the tool. Your data is always available to you, as is the benchmarking capability.

LinkedIn’s data is the result of its members contributing to it. I think the scores should be viewable in each account’s settings for all membership levels.

And what are your thoughts?

Just 5 Sites Command Almost Half Of All Finance Keyword Search Rankings

May I just say how much I love a free online tool?

The latest object of my affections is Ayima Pulse, which is a visualization of Google search rankings on more than 50,000 non-branded keywords. It offers “share of voice” leaderboards on the top Websites in 10 verticals, including Finance. (Insurance gets its own leaderboard, which is a refreshing departure from tools that track finance and insurance under one big ole financial services bucket.)

You’ll want to go and check it out yourself, but here’s what I’ve gleaned after spending some time on the site.

Search Ranking Volatility

Ayima provides a look at daily ranking changes over the last 30 days. According to the latest data, Finance search rankings are not volatile.

This has particular relevance now. We are just past the April 21 start of the rollout of "mobilegeddon," when Google said it would change its search algorithms to remove non-mobile-friendly sites from searches conducted on mobile devices. The expectation was that rankings would be significantly re-sorted as some sites would drop, the result of a Google penalty.

However, the Ayima data suggests that it was a non-event for Finance search leaders, judging both from the flatness of the volatility graphs and from a comparison of the leaders on desktop and mobile search. This looks to be the case, incidentally, for all the verticals except Gambling.

Finance Search Ranking Volatility.png

Search Leaders

What Ayima calls "Visibility (share of voice)" is calculated from the search volume, ranking and estimated clickthrough rate (CTR) of all sector keywords, converted into an overall percentage. Arrows indicate site movement within the leaderboard from the previous day.

Finance Search Ranking Leaders.png

To the right are the top 10 Websites ranking for Finance keywords. I've been watching this daily updated ranking for several days, by the way, and CNN and Yahoo frequently trade places between #1 and #2.

No investment product providers have broken into the top 10. Just two investment company brands—Fidelity at #34 and Schwab at #61—are on the larger list of 100 sites that Ayima makes available. Each site has less than 1% of share of voice. Related: Morningstar.com ranks #31.

Below is a look at how Fidelity and Schwab search visibility on mobile devices has fluctuated over the last 30 days. Fidelity has been more up and down, but both are labeled as mobile-friendly by Google and neither appears to have suffered from the algorithm change.

Schwab Fidelity Search Rankings.png

Search Concentration

The top five Finance Websites command 48%, or almost half, of the top finance keyword search rankings. That leaves every other finance site to slug it out for the other top keywords.

This is second only to the Jobs vertical—the top five Jobs sites snag 64% of their keyword rankings. There’s the least concentration in Education, where the top five leaders in that vertical attract have just 19% of all organic search rankings.  

Finance Desktop Search Ranking Concentration.png
Finance Mobile Search Ranking Concentration.png

Fear Of Missing Out?

So, what's to be made of the fact that mutual fund and exchange-traded fund (ETF) firms are nowhere to be found on the list of the top 100?

Buck up there, SEO-aware and socially-savvy asset management marketer, it's not a certainty that your sites are missing out. This is not necessarily a reflection of investment companies’ search performance because there are at least two pieces of information we don’t have:

  • We don’t know what the top 50,000+ Finance keywords are (an email I sent to Ayima has yet to be answered). In its April 20 introduction to Pulse, Ayima explained that “at midnight each day, we take Google’s top 100 organic search results for the most popular non-branded keywords relevant to our top 10 industries and add them to our database.” For a general idea of the top 1,000-ish Finance keywords, of course, you can always consult the Google AdWords Keyword Planner.
  • We don’t know what individual firms are seeking to rank for. Your keywords are probably long-tail. But...in an array of 50,000 keywords, there are likely to be words you want.

If you’re feeling competitive, I wouldn’t look at the top of the list where it can be no surprise that the media sites dominate. I’d look toward the bottom of the list. What do Visa’s PracticalMoneySkills.com (#94) and the American Finance Association Journal of Finance site (#62) do that you don’t? Should OurFreakingBudget.com (#83) outrank your site? Hmm, who knew that Pinterest.com (#27) was ranking for finance keywords?

On the topic of being anti-competitive, let’s take a moment to consider Google.com’s #3 ranking. Finance keyword searchers use Google, only to be taken by Google search engine rankings to a Google property (Google Finance or even just an inline result—see this post) almost 10% of the time? Interesting. 

If you spend your days thinking about how to effectively use Search to draw people to your business online, the visibility and volatility data provided by Ayima is all pretty interesting. It's another valuable tool to add to the digital marketing toolbox.